

IT security essentially reduces information-related risk to an acceptable ratio of risk to cost. For this reason, the process begins with an extensive risk assessment – a tried and tested process that can be improved. I am inspired by the work of Douglas Hubbard on this topic. Here’s why.
CISO Says... Lies! - PART III
Syyskuu 12, 2019 at 10:02
IT security essentially reduces information related risk to an acceptable ratio of risk to cost. For this reason, the process begins with an extensive risk assessment - a tried and tested process that can be improved. I am inspired by the work of Douglas Hubbard[1] on this topic. Here's why - part III.
In part one of the series, I explained the shortcomings of traditional IT risk assessment where we calculate risk as likelihood x maximum expected damage. I introduced an alternative where the expected damage is not a fixed amount, but follows a curve. In part two I explained how the curve (Probability Density Function) can be properly identified and created. In this installment we will address complex risk modelling, aggregated risk and the assessment of appropriate risk levels.
Complex risks
Take for instance, an airline with an online booking system, or even a digital bookstore. These entities risk losing sales if a customer cannot reach their website. This is a complicated risk to assess, because there can be many causal factors. There may be a problem with the server, or a denial of service (DDOS) attack[2], or perhaps even a software problem… each case is different. This is true in term of scope as well: perhaps all customers are affected, or just a smaller sub-group. It may occur at 2am in central Europe when sales are low but mid-morning in China when it is a bigger issue. It could even happen in the busiest week of the year.
There are multiple ways to analyse IT risks. The NIST SP 800-30 describes three approaches: (i)threat-oriented; (ii)asset/impact-oriented; and (iii)vulnerability oriented. All three topics should be addressed, but there is no pre-determined starting point. I like to begin by identifying the ration of asset to impact, followed by threats to the top management. After this, I can assess the operational vulnerabilities (note that these can be technical e.g. in software but can also be procedural). Once the information is complete, we can unpack a risk to formulate a better estimation for the client.
Taking the airline example, the asset is the online ticket selling system. Threatening actors may vary from criminals using ransomware, and competitors using Distributed Denial Of Service (DDOS), to disgruntled employees deleting important information. It is impossible to be aware of all technical vulnerabilities, but some things we can detect, such as when the account of an employee who has left the organization is not immediately deactivated.
It would make sense to break down the risk in at least two risks: (i) We lose sales because the website is down, and (ii) we lose sales because the website is (partly) down or contains wrong information. Both are considered asset/impact-oriented risks. The first risk is based on threatening actors: criminals, competitors, employees or other external parties that could perform the DDOS. Each actor is assessed as having the same impact and therefore the same possible mitigations. Information on competitors can be gathered to gain greater insight on what the frequency and duration of these attacks typically are. Further, we keep the assessment as simple as possible.
Information risk is just another business risk
When discussing risks with the board, it is good to keep in mind that IT (or Cyber) risks are not the only issues they are dealing with. AON, a worldwide operating insurance company, publishes a bi-annual report on common business risks[3]. Cyber risks are in the top 10, but only on 8th place (in Europe). On the other hand, on 4th place is damage to reputation/brand and a security incident might very well be the cause of this. When discussing IT risks with the board, we must remember that they are often considered in context to other pressing issues and present them in context to the other risks at hand. This can be a high-level discussion (‘loss of sales, because of the unavailable system’).
Sometimes ‘problems’ are misidentified as ‘risks’. A risk is something we have no control over and is unsure to happen. A problem is something that already happened or is happening. We have to deal with problems in different ways and this is out of scope for this blog series.
A ‘good risk’ is simple to understand and therefore easy to take mitigating action. A ‘good risk’ register contains a comprehensible set of risks. For IT we usually do not define more than five high level risks, but of course this is a bit dependent on the company and sector. We can dissect the risks in greater detail, but we aim not to assess more than 50 risks in order to avoid overwhelming complexity.
Aggregating risk
Once a list of risks is compiled and the upper and lower bounds of damage are estimated (see part 1) we can aggregate the risk.
For every risk, two things are calculated: 1) the probability that damage will be incurred 2) the probability density function when damage is incurred (see part 2). Random scenarios are often created for this purpose. We aggregate the damages to yield a total amount of damage for one random situation. The table below reflects such a hypothetical scenario (column “Random result”)
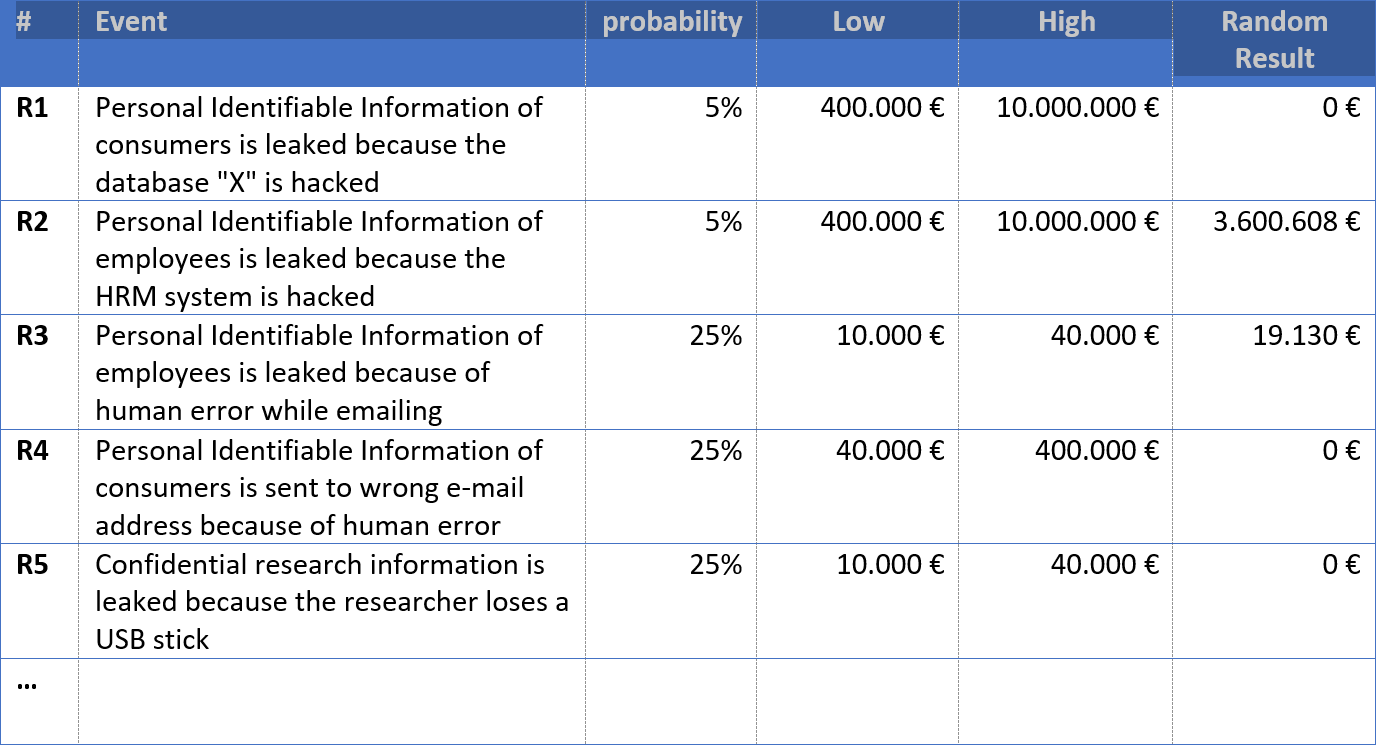
If we repeat this exercise frequently enough, we can more accurately predict probable damage. This is called a Monte Carlo Analysis.
Let’s say we do this 10.000 times. We will get 10.000 different results and from these we can calculate how probable it is that the total incurred damage will exceed a certain threshold. A typical graphic representation of this is below:
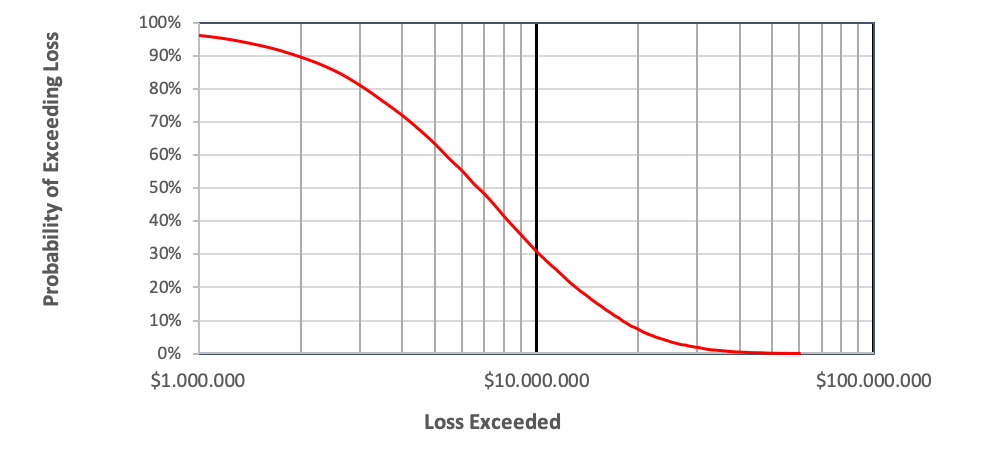
The sample graph illustrates the probability an excessive annual loss. In the example, there is a 30% probability that losses will exceed $10.000.000. The probability that is exceeds $1.000.000 is above the 90th percentile. By implementing extra security measures, we can reduce risk and recreate the graph. In doing so, we can compare various scenarios and evaluate the investment versus the reduced risk.
Using these kinds of graphics, it becomes easier to discuss IT risks with boards and C-suite executives.
In the next installment of this series, I will compare a traditional risk analysis with a quantitative analysis. It may sound bland, but I insist that you may be surprised with the outcome.
Sources:
[1] https://en.wikipedia.org/wiki/Douglas_W._Hubbard
[2] https://en.wikipedia.org/wiki/Denial-of-service_attack
[3] https://www.aon.com/2019-top-global-risks-management-economics-geopolitics-brand-damage-insights/index.html