

IT security essentially reduces information-related risk to an acceptable ratio of risk to cost. For this reason, the process begins with an extensive risk assessment – a tried and tested process that can be improved. I am inspired by the work of Douglas Hubbard on this topic. Here’s why.
CISO Says... Lies! - PART IV
October 10, 2019 at 10:16
IT security essentially reduces information related risk to an acceptable ratio of risk to cost. For this reason, the process begins with an extensive assessment - a tried and tested process that can be improved. I am inspired by the work of Douglas Hubbard[1] on this topic. Here's why - part IV a sample case comparing traditional risk analysis with quantitative risk analysis.
In part one of the series, I explained the shortcomings of traditional IT risk assessment where we calculate risk as likelihood multiplied by maximum expected damage. I introduced an alternative where the expected damage is not a fixed amount, but follows a curve. In part two I explained how the curve (Probability Density Function) can be properly identified and created. In part three we aggregated risk. In this instalment we include a case study comparing traditional risk analysis and quantitative risk analysis.
The case
Some time ago we performed a risk assessment with a client. This company employs a few hundred people and is a digital service provider. Every year an assessment is conducted, starting with a risk identification session where management, including the CEO, is present.
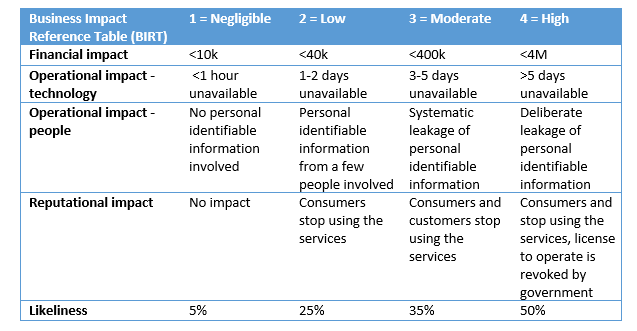
The first step was to define the business impact reference table (BIRT). Here we defined the negligible-low-mid-high levels of the impact and likeliness. Not only does this table define categories in monetary value, it also “translates” operational and reputational value to monetary value.
The second step is to identify risks, and estimations of the a) impact and b) likeliness, using the BIRT as a reference. Likeliness and Impact were chosen according to the table and the risk was calculated as Impact multipled by Likeliness. I asked the participants to rank the risks in terms of importance. After some discussion, the team came up with the following inventory (truncated list).
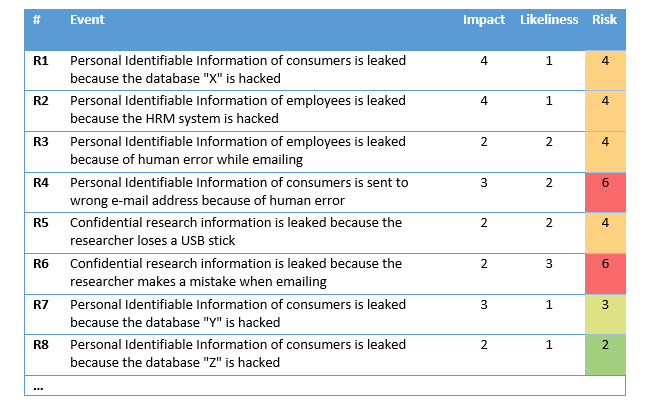
What is striking is the fact that the actual impact that risks have is not congruent with how participants perceived them to be. For example, risks R1 and R2 were identified by the team as two most harmful risks, while calculations show risks R4 and R6 to be most harmful to their company.
The Quantitative approach
The quantitative approach assumes damage is distributed. Damage is not fixed in any given incident but can vary in size. In part II this distribution is described. To estimate the distribution, we work with a 90% confidence interval (this entails defining a lower and upper bound of damage which is considered valid for 90% of the cases). For this case study we use the boundaries of the categories as defined in the BIRT. The results can be found in the table below[2].
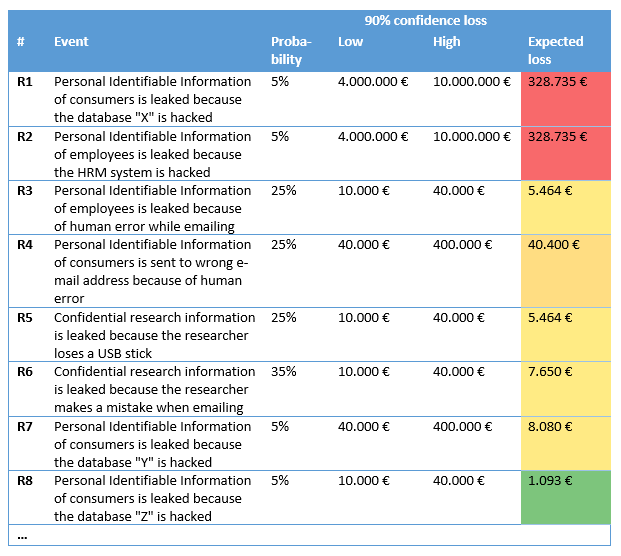
These outcomes are a much more accurate reflection of the team’s expectations. Risks R1 and R2 are identified as the main risks and to these two the other risks seem irrelevant.
Expected loss
It is very difficult for companies to estimate an annual loss using the traditional risk assessment. Calculating “maximum damages” multiplied by “likeliness” simply does not produce a constructive figure. Using the quantitative method, the expected loss calculation can be performed using Hubbard’s formula[3].
In this case the organization incurs an average annual loss of approximately 750.000€. This estimation was in fact far from accurate, making a good case for using quantitative analysis to achieve better estimates.
Conclusion
Quantitative risk analysis gives you more realistic results, while using the same data. It will give organizations insight in the expected losses, which can be used to fine-tune the estimates of likeliness and 90% confidence interval of impact. Once risks are better understood, mitigations can be developed more effectively, improving the ROI for cyber security.
Sources:
[1] https://en.wikipedia.org/wiki/Douglas_W._Hubbard
[2] Because there is no lower bound defined for category “negligible” and no upper bound for category “high” we have to add those. Objective values of 1.000€ for the lower bound an 10.000.000€ for the upper bound were assigned.
[3] Taken from his example Excel sheet: https://www.howtomeasureanything.com/cybersecurity/wp-content/uploads/sites/3/2019/06/OneforOne-Substitution-Model-2019c-HTMA-Cybersecurity-Version.xlsx